

Two office towers stand three blocks apart. Both are labeled Class A. Both have new lobbies, fast elevators, a fitness center and a coffee bar. One leases up before completion. The other sits at half occupancy for two years, and the owner keeps cutting asking rent to keep the lights on.
The label didn't predict either outcome. It never does, because the label isn't a grade stamped on a building. It's a description of where a building sits in its own market at a particular moment. Once you see it that way, the confusing parts start to make sense: why one city's Class A looks nothing like another's, why a building can fall out of the class without losing a single window, and why premium demand and high Class A vacancy can coexist in the same metro.
What a Class A Office Building Really Means
A class A office building is the top tier of its own local market: the properties competing for premier office users and generally commanding rents above the local average. The Building Owners and Managers Association describes the categories as a market-relative quality classification rather than a universally fixed engineering standard. Nothing in the definition sets a minimum floor plate, ceiling height, rent premium or age limit.
Think about hotel stars. A five-star hotel in one city earns that rating because it outclasses the other hotels there, not because it passed a single global inspection. Office classes work the same way. A class A office building in Atlanta, London or Singapore is measured against the competitive standard of its own metro, and the standard moves.
The lobby is usually where that standard announces itself first.

Classification weighs several dimensions at once:
- Rent and finishes: asking rents above the local average, supported by high-quality construction and current materials.
- Systems and efficiency: mechanical and electrical systems that are modern for the market, plus operating efficiency that holds up when someone asks for the numbers.
- Amenities and management: shared space, strong tenant services and professional management that a premier occupier expects.
- Location and perception: prominent or highly accessible sites, and the market's own read on a building's standing.
BOMA is explicit that the result is a subjective quality rating. Buildings migrate between classes as they age, after a major renovation, or when they gain or lose amenities. A tower that was the best address in town in 2005 can be a solid Class B building today without any wall moving.
Keep this in mind: Class A is a position in the local market, not a grade on a fixed scale.
The practical next step is to test any building against that attribute list before you use the label in marketing or pricing. Which attributes can you prove with dated records and photographs, and which ones are you assuming because the building is tall and the corridor is quiet?
Class A, B and C Side by Side
The three classes read best as one grid. Here's the pattern most markets follow.
Typical criteria for Class A, Class B and Class C offices
| Criterion | Class A | Class B | Class C |
|---|---|---|---|
| Typical age | Newer, or fully modernized | Mid-life, updated in parts | Older, with deferred upkeep |
| Location and access | Prime employment centers with strong transit | Good locations with mixed access | Secondary or weaker locations |
| Finishes and materials | High-quality, current finishes | Solid but dated in places | Basic or worn finishes |
| Building systems | Advanced, well-controlled mechanical and electrical | Adequate, with some upgrades needed | Older systems with limited controls |
| Amenities | Full tenant services and shared spaces | Some amenities | Few or none |
| Rent relative to local market | Above local average | Near local average | Below local average |
| Management | Professional and responsive | Standard | Basic or inconsistent |
Read the table as tendencies, not thresholds. No single cell decides the class. A building with a renovated lobby and twenty-year-old chillers sits halfway between two rows, and the market will treat it that way no matter what the leasing flyer says.
The ASHRAE Handbook explains the ranking by what sits under the finishes. Class B and Class C buildings generally rank lower because they have less advanced systems, lower-quality finishes, weaker locations or greater functional obsolescence, meaning the space is harder to lease to a modern occupier however it's dressed.
Two buildings, same age, different directions
Picture two twelve-year-old buildings on the same block. The first replaced its HVAC plant two years ago, rebuilt the lobby, added conference space and handed operations to a manager who answers tickets the same day. It reads as Class A today, and its rents reflect that.
The second deferred roof and chiller work, kept the original corridor lighting and let the management contract run on autopilot. Same vintage, same street, sliding toward Class B. Age barely differs. Maintenance history does.
That's also why the table can't replace local knowledge. A finishes package that reads premium in a secondary market reads ordinary in a gateway one, and the same cell value means two different things in two metros.
When you're screening a shortlist, tools that let you filter Loopnet listings by property type cut the noise quickly, especially when you need to compare office stock against neighboring asset types. Then use the table as a screening tool rather than a verdict: find the column that best matches the building, and inspect the rows where it disagrees with its own label.
The Criteria That Decide the Class A Label
Class A works like a class rank rather than a fixed grade: a building earns it by sitting near the top of its own market, and the criteria below are how you check whether it does. Walk through them in order and score what you find.
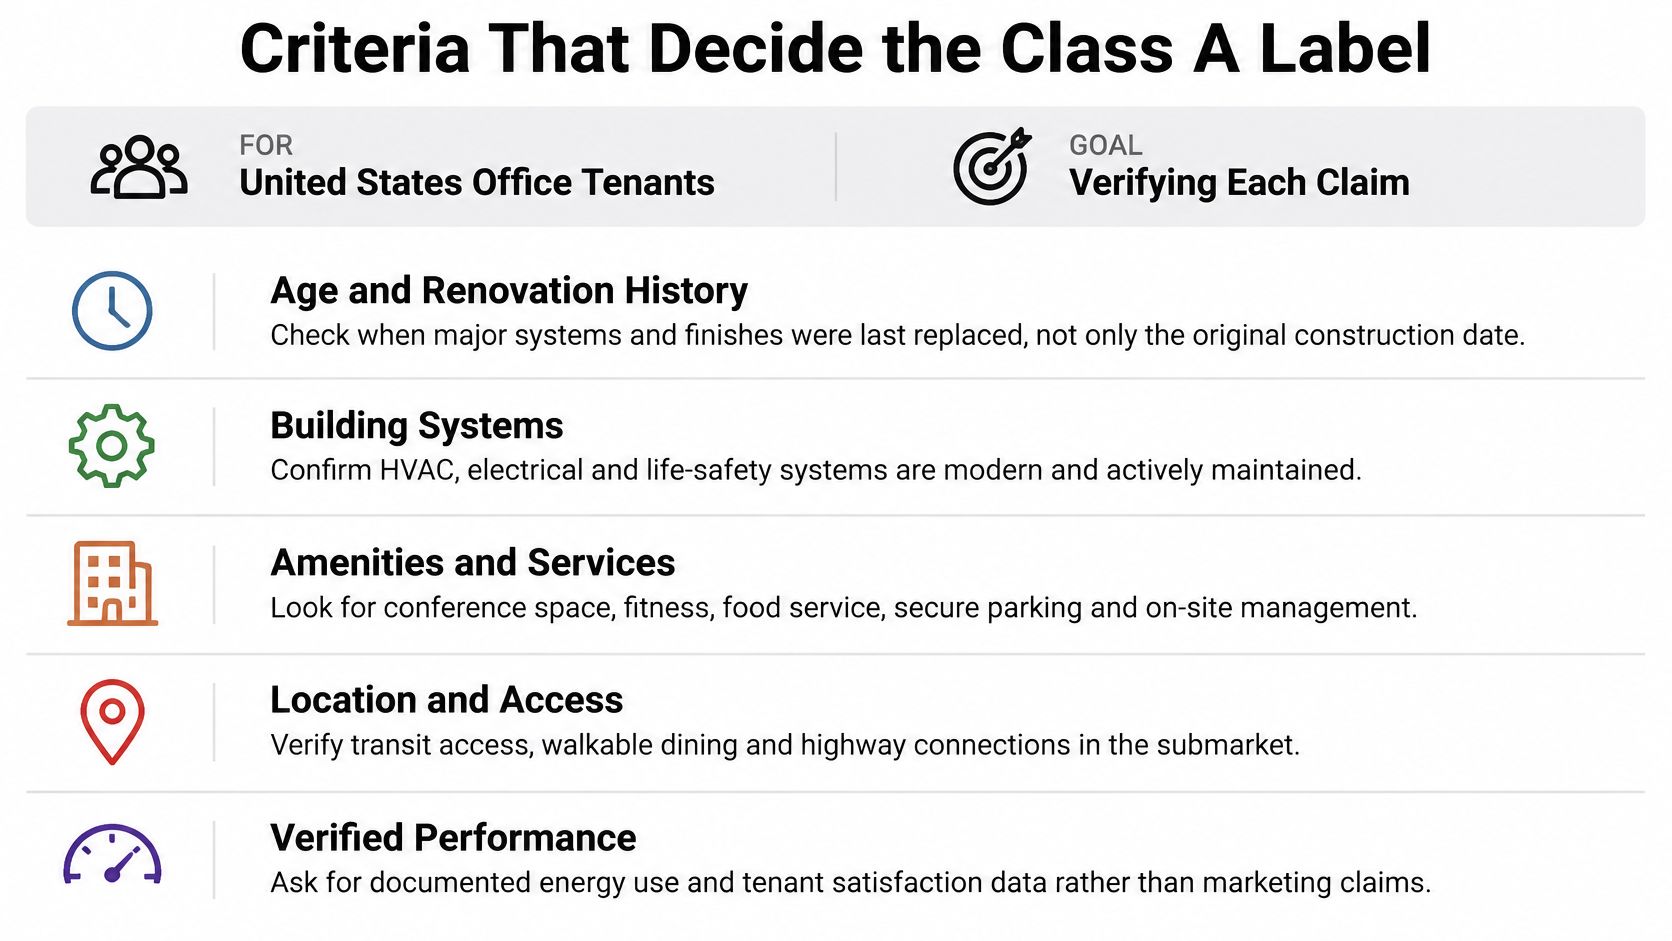
- Age and renovation history: the date the last major system or finish was replaced matters far more than the original construction date. Verify with permits and capital-expenditure records, not a plaque in the lobby.
- Location and access: proximity to a major employment center, transit, walking routes and vehicle access. Verify by walking the arrival sequence at 8:30 on a Tuesday.
- Finishes and materials: lobby, corridor and tenant-space quality. Verify with dated photographs of the actual building, never with renderings.
- Building systems and controls: whether mechanical and electrical plant is current and actively controlled. Verify with commissioning reports and building-automation trend logs.
- Amenities and services: conference space, fitness, food service, secure parking, on-site management. Verify by asking what's included in rent and what's billed back.
- Management: responsiveness and tenant experience. Verify through satisfaction survey results and the maintenance ticket history over the last two years.
- Rent and market perception: whether asking rents sit near the top of the local competitive set, not merely a little above it.
The market-relative test
The standard industry definition draws the line plainly: Class A offices compete for premier users and command the highest relative rents in their local office market, sit in major employment centers with strong transit, pedestrian and vehicle access, and typically pair high-quality finishes with state-of-the-art systems and high-quality management.
Every one of those terms is comparative. "Highest relative rents" means highest within that building's own competitive set, not above some national benchmark. There is no fixed rent premium, floor-area threshold or age limit built into the term.
This is the point that trips readers up. A tower that leads its submarket in a mid-size city can carry the label, while a better-finished building in a gateway market can miss it, because stronger rivals surround it. The label describes a position, and positions shift when the competition does.
Score the criteria, then note the gaps
Rate each criterion from one to five against local comparables, and write down the evidence behind every score. Missing evidence is where a label is most often overstated: the chiller replacement nobody can date, the tenant survey nobody ran, the amenity that exists on the site plan but not on the floor.
Exterior imagery does real work here, because office building exteriors show material quality, glazing, entry sequence and context in a way an interior set can't. If the criteria hold up, the photograph proves it. If they don't, the photograph shows that too.
Why Class A Does Not Guarantee Full Buildings
The comfortable version of the story says quality always wins. U.S. vacancy data complicates it.
In the first quarter of 2026, Class A vacancy in the United States was 21.1%, against 16.9% for Class B, even as Class A captured most of the leasing activity, according to the Colliers U.S. national office outlook. Both statements are true at once. Tenants aren't spreading evenly across every building that carries the label. They're concentrating in a narrower subset of it.
That subset splits the supply in two. Trophy-quality space at the very top leases, sometimes at record rents. A much larger pool of commoditized "A" buildings competes on concessions and still struggles. The label covers both, which is why it says so little on its own.
What turns a labeled building into a preferred one
The attributes that separate the two groups are specific and mostly checkable: transit access, neighborhood quality, hospitality-level amenities, flexible floor plates, strong building operations, sustainability performance and technology infrastructure. Notice how few of them are visible from the curb on a drive-by.
Consider two Class A towers in the same district. The first offers floor plates that subdivide cleanly, an operations team that answers within the hour, and documented energy performance a tenant's sustainability lead can drop into a report. It leases quickly and holds rent. The second carries the same label with static floor plans, a slow work-order queue and no performance data. It fills slowly, and only with concessions.
Test before you price: if the only evidence for the premium is the age of the finishes, the market will price the building closer to Class B.
Before pricing a building as Class A, rate it on each differentiator and check whether the label is backed by tenant experience or only by recent cosmetics. Good commercial property marketing leans on the features that move decisions: arrival sequence, daylight, shared amenities, circulation, views and context, not just a tower shot against a sunset.
What Class A Status Means for Rent and Leasing
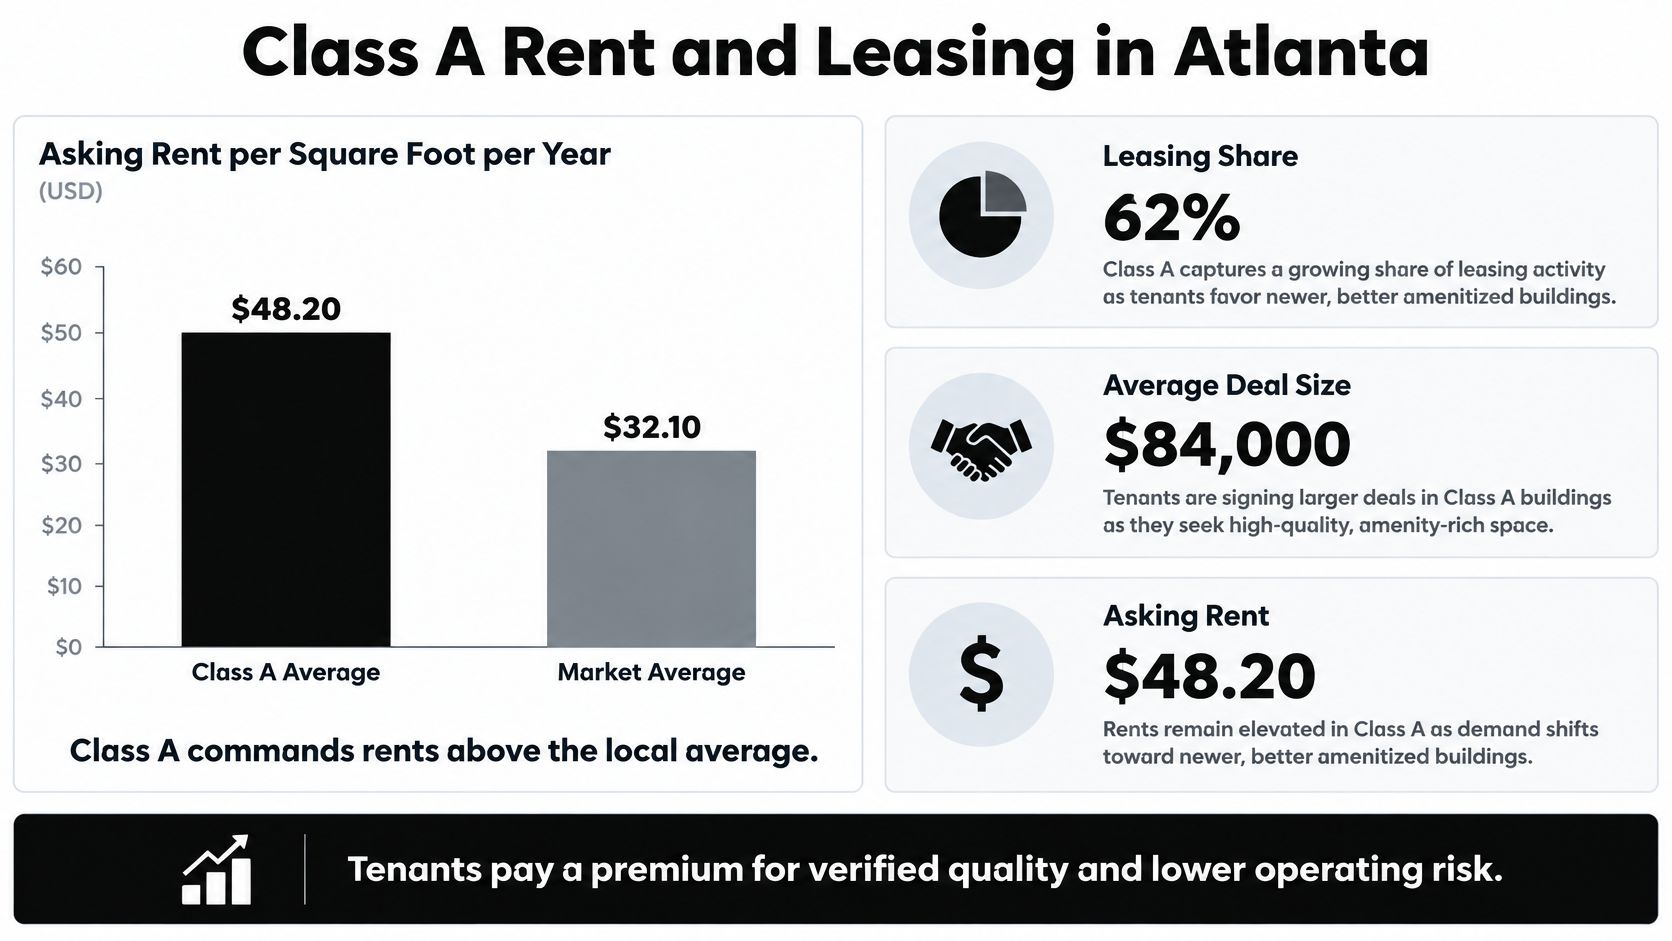
Rent answers one question: what will the market pay for this building's position? In Atlanta, Class A space showed a clear premium in the third quarter of 2025. Asking rent reached $35.33 per square foot, up 1.0% from Q2 and 5.3% from a year earlier. Those figures come from Atlanta leasing data, not from a general definition of office classes.
Atlanta Class A leasing benchmarks against the market
| Metric | Class A | Market average |
|---|---|---|
| Asking rent, Q3 2025 | $35.33 per sq ft | $35.33 per sq ft |
| Asking rent change, Q3 2025 | Up 1.0% from Q2, up 5.3% year over year | Not reported in this benchmark |
| Share of leasing by sq ft, Q3 2025 | 73.4% | 100% (total) |
| Share of deal count, Q3 2025 | 51.4% | 100% (total) |
| Average lease size, Q3 2025 | 8,897 sq ft | 6,225 sq ft |
| Share of leasing by sq ft, Q2 2025 | 62.1% | 100% (total) |
| Share of deal count, Q2 2025 | 51.8% | 100% (total) |
| Average lease size, Q2 2025 | 6,595 sq ft | 5,504 sq ft |
The useful signal sits in the gap between square footage and deal count. Class A captured 73.4% of leased square footage while accounting for 51.4% of deals. In plain terms, Class A buildings won fewer transactions than their share of space might suggest, but the transactions they won were larger. The average Class A lease was 8,897 square feet, compared with 6,225 square feet across the market.
Think of the market as a set of scales. A label can lift a building's asking rent, but the tenant's decision weighs floor plates, services, location and operating quality on the other side. If the building cannot hold that weight, the premium shows up on the brochure and disappears in the signed lease.
The bigger-deal pattern in plain terms
A tenant with roughly 9,000 square feet to place usually arrives with a facilities standard, a procurement process and options. That tenant needs a building that can absorb the space without forcing an awkward layout. Larger occupiers also tend to scrutinize operations, access and the quality of the working environment before they commit.
Q2 2025 shows the same shape. Class A took 62.1% of leasing volume by square footage on 51.8% of deal count, with average leases of 6,595 square feet versus 5,504 square feet market-wide. Two consecutive quarters with that pattern point to a consistent market behavior: premium space is winning the larger requirements, while the total number of deals tells only part of the story.
How to use the benchmark on a real building
Start with the local Class A benchmark, not the national idea of Class A. A building in Atlanta should be read against Atlanta leasing conditions, and even within the city, submarkets can behave differently. The Class A label is a position in a local market, so rent evidence has to come from the same market where the building competes.
Then test the building against the tenant profile behind those larger deals. Can the floor plates support a clean layout for an occupier several thousand square feet larger than the market average? Are the building systems, access and day-to-day operations strong enough to support the asking rent? A lobby photograph can explain the first impression, but it cannot prove the building will perform for a large tenant.
Track direction over time as well as the current number. Q2 and Q3 show rent movement and deal-size patterns side by side, which gives a more stable read than one headline figure. If asking rent rises while average lease size stays ahead of the market, the premium has some support. If rent rises without that tenant demand, the question becomes what evidence justifies the gap.
Here is a walkthrough of how the space itself reads to that larger tenant.
For owners and marketers, the practical job is to connect the price to proof. Set asking rent against the local Class A benchmark, then show the parts of the building that support it: floor plates, arrival sequence, shared areas, daylight and the details a tenant will see during a tour. Keep commercial real estate offices documented as those spaces change, because a repositioning often becomes visible in the building experience before it appears in the rent roll.
Valuing Class A Income
Class A income is worth what its rent roll is worth, not what its lobby is worth. Buyers underwrite the durability of the cash flow first and argue about the multiple second.
The income approach is short. Value equals net operating income divided by a capitalisation rate. Net operating income is rent collected minus operating expenses, before debt service and income taxes. If you want the line-by-line version, this walkthrough of the net operating income formula explained is a clean reference.
Say a 100,000 square foot building leases at $35 per square foot with 90% occupancy. That's roughly $3.15 million in gross rent before operating costs. A Class B neighbor at a lower local rent with the same occupancy produces less income, so it prices lower even after you adjust for condition. The gap in value comes from the rent line, not the front door.
What buyers pay for and what they discount
Buyers pay premiums for tenant quality, long lease terms and rent resilience through a downturn. They discount for lease-up risk, the capital expenditure needed to hold the label, and tenant improvement allowances and free rent that reduce effective rent well below the face rate. A generous concession package can make a Class A lease look strong in the brochure and weak in the model.
The label itself isn't valued. The evidence behind it is. Compare asking rent to local Class A averages before you underwrite, then model a downside case where a major tenant departs or the systems age out and the building slips toward Class B in the market's eyes.
One more risk sits inside the Class A story. Larger deals concentrate exposure, so a single departure can move occupancy sharply. Underwrite that scenario explicitly, and ask what the floor plan and amenity set do to re-lease the space at the same rent.
Measuring Performance and Confirming the Class
A claim about building systems is only worth the measurement behind it. Advanced plant creates value when it's commissioned, controlled and operated well, and a building with careless controls can burn more energy than an older one with attentive management.
The plant room is where the performance claim either holds or falls apart.

Energy use intensity in plain terms
Energy use intensity divides annual energy consumption by gross floor area, which makes buildings of different sizes comparable. EUI works like a miles-per-gallon rating: one number that puts a small suburban office and a downtown tower on the same scale. The EPA's ENERGY STAR guidance on EUI explains the two versions of the metric, site EUI, which counts energy where the building uses it, and source EUI, which adds generation and transmission losses upstream. Published benchmarks give you a reference point for the comparison.
The spread matters more than the midpoint. Office energy use varies widely across the stock, and the most intensive buildings burn several times the energy of the most efficient ones, so a single figure never settles the question. Comparisons only hold when you account for climate, occupancy, operating hours, equipment loads and ventilation.
Benchmarking uses 12 months of consumption plus building characteristics to produce a 1 to 100 score. A score of 75 or higher marks top-quartile performance and can support certification when other indoor-environment requirements are met.
The U.S. General Services Administration shows what verified performance looks like in practice: its high-performance buildings averaged 47.85 kBtu per gross square foot against 60.61 for legacy stock, a 21% reduction, with water use intensity 29% lower.
What to verify and what to photograph
- Submetering and trend data: ask for twelve months of whole-building and tenant-level consumption, not a utility bill summary.
- Controls and commissioning: building-automation trends, economizer operation, variable-frequency drives, demand-controlled ventilation and a retro-commissioning report.
- Envelope and daylight: high-performance glazing, exterior shading and the daylight strategy behind it.
- Resilience infrastructure: backup power, connectivity redundancy and the systems that keep a tenant trading through an outage.
Each item on that list has a matching image. Mechanical rooms, control panels, shading devices and dusk lighting tell a verifiable story when they're paired with the metric they support. Our architectural photography pairs sweeping exteriors and refined interiors with that plant-room and detail work, because form, light and detail are what make a technical claim legible.
Verification is not a one-time exercise either. Tracking energy, water and work-order trends quarter over quarter shows whether the systems still perform the way the commissioning report promised, and teams that compare facilities dashboard metrics and targets catch drift before it surfaces in a tenant survey or a lapsed score.
Three steps close the loop before anyone uses the label:
- Gather the records: age and renovation dates, capital expenditure history, twelve months of energy and water data, tenant survey results.
- Score each criterion against the local Class A benchmark, and mark plainly where evidence is missing.
- Commission the imagery that proves it, then publish the photographs beside the verified figures rather than instead of them.
If the evidence exists, it deserves to be seen clearly, and that's the work we do. Jimmy Clemmons Photographer is an Atlanta studio specializing in architectural photography and corporate brand content, from sweeping exteriors and refined interiors to the amenity floors and building systems that carry a premium claim. Visit Jimmy Clemmons Photographer to plan a shoot that documents what your building can prove.